- Tardigrade
- Question
- Biology
- When two plants L and M were exposed to different light intensities and temperatures, they showed changes in their rates of photosynthesis, which have been represented in the following graph. <img class=img-fluid question-image alt=image src=https://cdn.tardigrade.in/img/question/biology/05334c83808fe715c6881573d2ba21a7-.png /> The graph indicates that
Q.
When two plants L and M were exposed to different light intensities and temperatures, they showed changes in their rates of photosynthesis, which have been represented in the following graph.
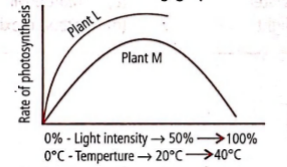
The graph indicates that
Solution: