Question Error Report

Thank you for reporting, we will resolve it shortly

Back to Question

Q. When two plants L and M were exposed to different light intensities and temperatures, they showed changes in their rates of photosynthesis, which have been represented in the following graph.
image
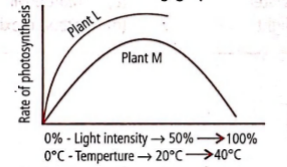
The graph indicates that

Photosynthesis in Higher Plants

Solution:

The light intensity at which a plant can achieve maximum rate of photosynthesis is called as light saturation point. Its value is $50-70\%$ of full sunlight in $C_{3}$ sun plants and upto $200\%$ of full sunlight in $C_{4}$ sun plants (e.g., sugarcane), Beyond saturation point (it is seldom realised in nature in $C_{4}$ sun plants), the rate of photosynthesis begins to decline, Optimum temperature at which the rate of photosynthesis is maximum is $10^\circ C - 25^\circ C$ for$C_{3}$ plants and $30-45^\circ C$ for $C_{4}$ plants. Thus, it is clear that in the given graph, plant $L$ is a $C_{4} $ plant and plant $M$ is a $C_{3}$ plant.