Tardigrade
Tardigrade - CET NEET JEE Exam App
Exams
Login
Signup
Tardigrade
Question
Chemistry
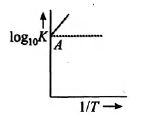
Variation of log10 K with (1/T) is shown by the following graph in which straight line is at 45°, hence Δ Ho is: <img class=img-fluid question-image alt=image src=https://cdn.tardigrade.in/img/question/chemistry/a586b3f757d26117edd3c5623abd9abc-.jpeg />
Q. Variation of log
10
K
with
T
1
is shown by the following graph in which straight line is at
45°
,
hence
Δ
H
o
is:
1796
288
Equilibrium
Report Error
A
+
4.606
c
a
l
31%
B
−
4.606
c
a
l
34%
C
2
c
a
l
29%
D
−
2
c
a
l
6%
Solution:
Slope of plot
=
2.303
R
−
Δ
H
o
=
1
⇒
Δ
H
o
=
−
2.303
×
2
=
−
4.606
cal