Tardigrade
Tardigrade - CET NEET JEE Exam App
Exams
Login
Signup
Tardigrade
Question
Chemistry
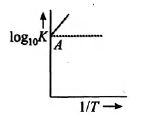
Variation of log10 K with (1/T) is shown by the following graph in which straight line is at 45°, hence Δ Ho is: <img class=img-fluid question-image alt=image src=https://cdn.tardigrade.in/img/question/chemistry/a586b3f757d26117edd3c5623abd9abc-.jpeg />
Question Error Report
Question is incomplete/wrong
Question not belongs to this Chapter
Answer is wrong
Solution is wrong
Answer & Solution is not matching
Spelling mistake
Image missing
Website not working properly
Other (not listed above)
Error description
Thank you for reporting, we will resolve it shortly
Back to Question
Thank you for reporting, we will resolve it shortly
Q. Variation of log$_{10} K$ with $\frac{1}{T}$ is shown by the following graph in which straight line is at $45°,$ hence $\Delta H^{o}$ is:
Equilibrium
A
$+4.606\, cal$
31%
B
$-4.606\, cal$
34%
C
$2\, cal$
29%
D
$- 2\, cal$
6%
Solution:
Slope of plot $= \frac {-\Delta H^{o}}{ 2.303R}=1$
$\Rightarrow \Delta H^{o} =-2.303 \times 2=-4.606$ cal