- Tardigrade
- Question
- Physics
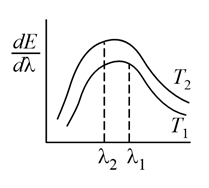
- The spectral emissive power textEλ for a body at temperature T1 is plotted against the wavelength (see figure) and area under the curve is found to be A . At a different temperature T2 the area is found to be 9 A . Then λ 1 / λ 2 = <img class=img-fluid question-image alt=Question src=https://cdn.tardigrade.in/q/nta/p-8r5nlylsczeusjoz.jpg />
Q.
The spectral emissive power for a body at temperature is plotted against the wavelength (see figure) and area under the curve is found to be . At a different temperature the area is found to be . Then
Solution: