- Tardigrade
- Question
- Biology
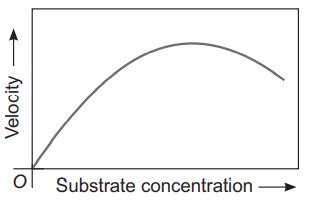
- The given graph shows the effect of substrate concentration on the rate of reaction of the enzyme green gram-phosphatase. What does the graph indicate? <img class=img-fluid question-image alt=image src=https://cdn.tardigrade.in/img/question/biology/5fda0155423ffb0ffe46ea3790b42504-.png />
Q.
The given graph shows the effect of substrate concentration on the rate of reaction of the enzyme green gram-phosphatase. What does the graph indicate?
Solution: