Question Error Report

Thank you for reporting, we will resolve it shortly

Back to Question

Q. 
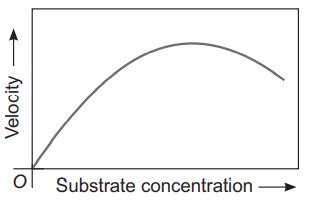
The given graph shows the effect of substrate concentration on the rate of reaction of the enzyme green gram-phosphatase. What does the graph indicate?
image

AIIMSAIIMS 2008

Solution:

In given, graph initially rate of enzymatic reaction increases but after some time began to slow down.