Q.
The given curve represents the variation of temperature as a function of volume for one mole of an ideal gas. Which of the following curves best represents the variation of pressure as a function of volume?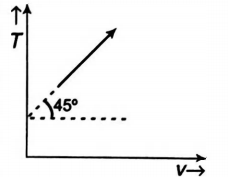
Solution: