Question Error Report

Thank you for reporting, we will resolve it shortly

Back to Question

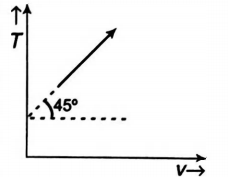
Q. The given curve represents the variation of temperature as a function of volume for one mole of an ideal gas. Which of the following curves best represents the variation of pressure as a function of volume?Physics Question Image
Kinetic Theory

Solution:

Here, $T=V \tan 45^{\circ}+T_{0}$
$\Rightarrow T=V +T_{0}$
And $P=\frac{n R T}{V}$,
$\therefore \frac{P V}{R}=V+T_{0}$ (Since, n =1)
$(P-R) V=R T_{0}$
Therefore, graph will be rectangular hyperbola.