- Tardigrade
- Question
- Biology
- The following graph shows the range of variation among population members for a trait determined by multiple genes. <img class=img-fluid question-image alt=image src=https://cdn.tardigrade.in/img/question/biology/b4d0695bf045571b4f307113d05b0a01-.png /> If this population is subject to stabilizing selection for several generations, which of the distributions (a-d) is most likely to result?
Q.
The following graph shows the range of variation among population members for a trait determined by multiple genes.
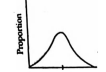
If this population is subject to stabilizing selection for several generations, which of the distributions (a-d) is most likely to result?
Solution: