Q.
The following graph shows the range of variation among population members for a trait determined by multiple genes.
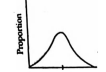
If this population is subject to stabilizing selection for several generations, which of the distributions (a-d) is most likely to result?
Evolution
Solution: