Q.
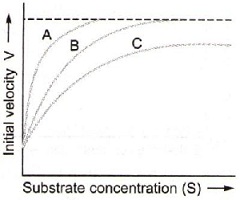
The figure given below shows three velocity substrate concentration curves for an enzyme reaction. What do the curves A, B and C depict respectively?
1126
306
NTA AbhyasNTA Abhyas 2020Biomolecules
Report Error
Solution:
In the figure given in question, curve a shows normal enzyme reaction while curve b shows a competitive inhibition reaction, in which the inhibitor resembles the substrate molecules, bind to the active site of the enzyme. Due to its close structural similarity with the substrate, the inhibitor competes with the substrate for the substrate-binding site of the enzyme. Consequently, the substrate cannot bind and as a result, the enzyme action declines.
Curve c shows non-competitive inhibition reaction, in which the inhibitor binds to a part of the enzyme or enzyme-substrate complex, other than the active site, known as the allosteric site. In such a case, the inhibitor reduces the activity of the enzyme and binds equally well to the enzyme whether or not it has already bound the substrate.