Q.
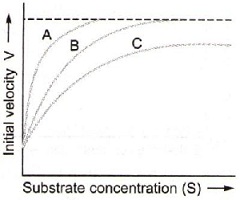
The figure given below shows three velocity substrate concentration curves for an enzyme reaction. What do the curves A, B and C depict respectively?
NTA AbhyasNTA Abhyas 2020Biomolecules
Solution: