Q.
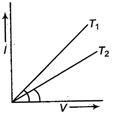
The current-voltage graph for a given metallic wire at two different temperatures T1 and T2 is shown in the figure. The temperatures T1 and T2 are related as
Slope of the V-i curve at any point is equal to resistance at that point. From the curve slope for T1> slope for T2RT1<RT2⇒ Also at higher temperature resistance will be higher so T2>T1.