Q.
The current-voltage graph for a given metallic wire at two different temperatures $ {{T}_{1}} $ and $ {{T}_{2}} $ is shown in the figure. The temperatures $ {{T}_{1}} $ and $ {{T}_{2}} $ are related as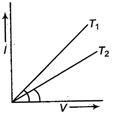
VMMC MedicalVMMC Medical 2014
Solution: