Tardigrade
Tardigrade - CET NEET JEE Exam App
Exams
Login
Signup
Tardigrade
Question
Chemistry
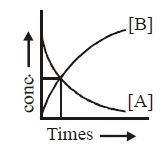
The accompanying figure depicts a change in concentration of species A and B for the reaction A → B, as a function of time. The point of inter section of the two curves represents
Q. The accompanying figure depicts a change in concentration of species
A
and
B
for the reaction
A
→
B
, as a function of time. The point of inter section of the two curves represents
3905
292
BITSAT
BITSAT 2018
Report Error
A
t
1/2
56%
B
t
3/4
17%
C
t
2/3
18%
D
Data insufficient to predict
8%
Solution:
The intersection point indicates the half life of the reactant
A
when it is converted to
B
.