Q.
The accompanying figure depicts a change in concentration of species $A$ and $B$ for the reaction $A \to B$, as a function of time. The point of inter section of the two curves represents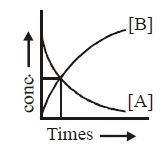
BITSATBITSAT 2018
Solution: