Tardigrade
Tardigrade - CET NEET JEE Exam App
Exams
Login
Signup
Tardigrade
Question
Physics
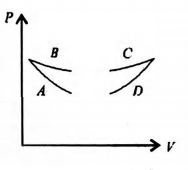
Four curves A, B, C and D are drawn in the fig. for a given amount of gas. The curves which represent adiabatic and isothermal changes are
Q. Four curves A, B, C and D are drawn in the fig. for a given amount of gas. The curves which represent adiabatic and isothermal changes are
2775
296
Thermodynamics
Report Error
A
C and D respectively
0%
B
D and C respectively
17%
C
A and B respectively
67%
D
B and A respectively
17%
Solution:
As pressure decreases, volume increases for both adiabatic and isothermal change. The slope of adiabatic is steeper than the isothermal.