Tardigrade
Tardigrade - CET NEET JEE Exam App
Exams
Login
Signup
Tardigrade
Question
Physics
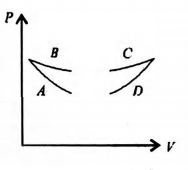
Four curves A, B, C and D are drawn in the fig. for a given amount of gas. The curves which represent adiabatic and isothermal changes are
Question Error Report
Question is incomplete/wrong
Question not belongs to this Chapter
Answer is wrong
Solution is wrong
Answer & Solution is not matching
Spelling mistake
Image missing
Website not working properly
Other (not listed above)
Error description
Thank you for reporting, we will resolve it shortly
Back to Question
Thank you for reporting, we will resolve it shortly
Q. Four curves A, B, C and D are drawn in the fig. for a given amount of gas. The curves which represent adiabatic and isothermal changes are
Thermodynamics
A
C and D respectively
0%
B
D and C respectively
17%
C
A and B respectively
67%
D
B and A respectively
17%
Solution:
As pressure decreases, volume increases for both adiabatic and isothermal change. The slope of adiabatic is steeper than the isothermal.