- Tardigrade
- Question
- Physics
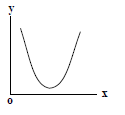
- Column I gives a list of possible set of parameters measured in some experiments. The variations of the parameters in. the form of graphs are shown in Column II. Match the set of parameters given in Column I with the graph given in Column II. Indicate your answer by darkening the appropriate bubbles of the 4 × 4 matrix given in the ORS. Column I Column II A Potential energy of a simple pendulum (y axis) a a function of displacement ( x axis) p <img class=img-fluid question-image alt=image src=https://cdn.tardigrade.in/img/question/physics/335751d14acf20de66545f288df66c97-.png /> B Displacement (y axis) as a function of time ( x axis) for a one dimensional motion at zero or constant acceleration when the body is moving along the positive x-direction q <img class=img-fluid question-image alt=image src=https://cdn.tardigrade.in/img/question/physics/4fe170af35ae288808a5a1b5db1548aa-.png /> C Range of a projectile (y axis) as a function of its velocity (x axis) when projected at a fixed angle r <img class=img-fluid question-image alt=image src=https://cdn.tardigrade.in/img/question/physics/4da02bb340f550ff8015fbb22ea68f12-.png /> D The square of the time period (y axis) of a simple pendulum as a function of its length (x axis) s <img class=img-fluid question-image alt=image src=https://cdn.tardigrade.in/img/question/physics/e3da445431c4685a94bc83ade6980a93-.png />
Q.
Column I gives a list of possible set of parameters measured in some experiments. The variations of the parameters in. the form of graphs are shown in Column II. Match the set of parameters given in Column I with the graph given in Column II. Indicate your answer by darkening the appropriate bubbles of the matrix given in the ORS.
Column I
Column II
A
Potential energy of a simple pendulum (y axis) a a function of displacement ( axis)
p
B
Displacement (y axis) as a function of time ( axis) for a one dimensional motion at zero or constant acceleration when the body is moving along the positive -direction
q

C
Range of a projectile (y axis) as a function of its velocity (x axis) when projected at a fixed angle
r

D
The square of the time period (y axis) of a simple pendulum as a function of its length (x axis)
s

| Column I | Column II | ||
|---|---|---|---|
| A | Potential energy of a simple pendulum (y axis) a a function of displacement ( axis) | p | |
| B | Displacement (y axis) as a function of time ( axis) for a one dimensional motion at zero or constant acceleration when the body is moving along the positive -direction | q | |
| C | Range of a projectile (y axis) as a function of its velocity (x axis) when projected at a fixed angle | r | |
| D | The square of the time period (y axis) of a simple pendulum as a function of its length (x axis) | s | |
Solution: