Q. 
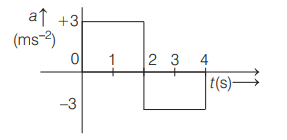
A particle starts from rest at and undergoes an acceleration in with time in seconds which is shown in figure. Which one of the following plot represents velocity in versus time in second? Physics Question Image

 618  154 Motion in a Straight Line Report Error

Solution:

From graph, we observe that
image
For to is positive, i.e. . So, graph will be a straight line with positive slope. For to is negative , so graph will be a straight line with negative slope. Complete - graph will be as below.
image
Also, Area under graph for to
, which is the maximum velocity attained.
This is shown in graph .