Question Error Report

Thank you for reporting, we will resolve it shortly

Back to Question

Q. 
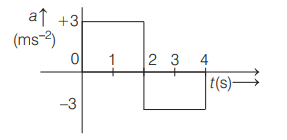
A particle starts from rest at $t=0 \,s$ and undergoes an acceleration $a$ in $ms ^{-2}$ with time $t$ in seconds which is shown in figure. Which one of the following plot represents velocity $v$ in $ms ^{-1}$ versus time $t$ in second?Physics Question Image

Motion in a Straight Line

Solution:

From $a-t$ graph, we observe that
image
For $t=0 \,s$ to $t=2\, s ; a$ is positive, i.e. $a>0$. So, $v-t$ graph will be a straight line with positive slope. For $t=2 \,s$ to $t=4\, s , a$ is negative $(a < 0)$, so $v-t$ graph will be a straight line with negative slope. Complete $v$ - $t$ graph will be as below.
image
Also, $v=$ Area under $a-t$ graph for $t=0 \,s$ to $t=2 s\,$ $=3 \times 2$
$\Rightarrow v=6\, ms ^{-1}$, which is the maximum velocity attained.
This is shown in graph .