- Tardigrade
- Question
- Physics
- A fixed mass of ideal gas undergoes changes of pressure and volume starting at L, as shown in figure <img class=img-fluid question-image alt=image src=https://cdn.tardigrade.in/img/question/physics/4d7db2b316964235b00e8c0ff43b93ef-.png /> Which graph shows how temperature (measured in Kelvin) changes with volume?
Q.
A fixed mass of ideal gas undergoes changes of pressure and volume starting at L, as shown in figure
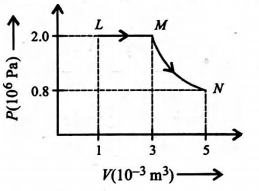
Which graph shows how temperature (measured in Kelvin) changes with volume?
Solution: