Question Error Report

Thank you for reporting, we will resolve it shortly

Back to Question

Q. A fixed mass of ideal gas undergoes changes of pressure and volume starting at L, as shown in figure
image
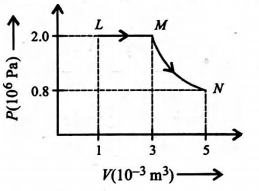
Which graph shows how temperature (measured in Kelvin) changes with volume?

Thermodynamics

Solution:

IN $L$ to $M,$ pressure is constant so, $\frac{V}{T}=$ constant
$\Rightarrow T$ vs $V$ graph will be a straight line with some positive slope. $M$ to $N$ is not isothermal as
$P_{M} V_{M}=\left(2 \times 10^{6}\right)(0.003)=6 \times 10^{3} \,J$
$P_{N} V_{N}=\left(0.8 \times 10^{6}\right)(0.005)=4 \times 10^{3} \,J$
$P_{M} V_{M} \neq P_{N} V_{N}$
Now, $\frac{P_{M} V_{M}}{T_{M}}=\frac{P_{N} V_{N}}{T_{N}}$ or $\frac{6 \times 10^{3} J }{T_{M}}=\frac{4 \times 10^{3} J }{T_{N}}$
$6 T_{N}=4 T_{M}$
$3 T_{N}=2 T_{M} \Rightarrow T_{M}=\frac{3}{2} T_{N}$
$T_{M}>\,T_{N}$