Q. Which of the following graphs are correct for a zero order reaction?
Chemical Kinetics
Solution:
For a zero order reaction,
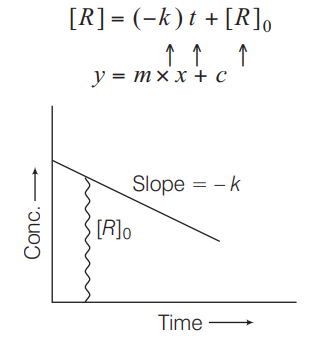
On comparing with equation of straight line $y=[R]$ concentration
$x=t$ time
Slope $(m)=-k$ rate constant
Intercept $(c)=[R]_{0}$ initial concentration
On rearranging Eq. (i)
$\frac{[R]-[R]_{0}}{t}=-k$
$\frac{[R]-[R]_{0}}{t}=-k t^{0}$
Rate $\propto t^{0}$