Question Error Report

Thank you for reporting, we will resolve it shortly

Back to Question

Q. The volume versus temperature graph of $1$ mole of an ideal gas is given below
image
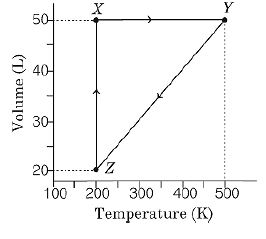
The pressure of the gas (in atm) at $X$ , $Y$ and $Z,$ respectively, are

KVPYKVPY 2015Solutions

Solution:

According to ideal gas equation
$pV =nRT$
For 1 mole, $n = 1$
$\therefore pV=RT$
$\Rightarrow p=\frac{RT}{V}$
For gas $X$,
$V=50\,L,\, T= 200\,K$
$\therefore $ Pressure of gas $X=\frac{0.0821\times200}{50}$
$=0.328$ atm
for gas $Y$
$ V=50\,L,\,=500\,K$
$\therefore $ Pressure of gas $Y=\frac{0.0821\times500}{50}$
$=0.821$ atm
for gas $Z,$
$V=20\,L,\, T=200\,K$
$\therefore $ Pressure of gas $Z =\frac{0.0821\times200}{20}$
$ 0.821\, atm$