Tardigrade
Tardigrade - CET NEET JEE Exam App
Exams
Login
Signup
Tardigrade
Question
Chemistry
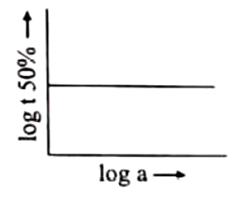
A graph plotted between log t50 % vs. log concentration is a straight line. What conclusion can you draw from the given graph <img class=img-fluid question-image alt=Question src=https://cdn.tardigrade.in/q/nta/c-rdrgjokvjalfjkdg.jpg />
Question Error Report
Question is incomplete/wrong
Question not belongs to this Chapter
Answer is wrong
Solution is wrong
Answer & Solution is not matching
Spelling mistake
Image missing
Website not working properly
Other (not listed above)
Error description
Thank you for reporting, we will resolve it shortly
Back to Question
Thank you for reporting, we will resolve it shortly
Q. A graph plotted between log $t_{50 \%}$ vs. log concentration is a straight line. What conclusion can you draw from the given graph
NTA Abhyas
NTA Abhyas 2022
A
$n=1,t_{1 / 2}=\frac{0.693}{k}$
B
$n=2,t_{1 / 2}=\frac{1}{a}$
C
$n=1,t_{1 / 2}=\frac{1}{k . a}$
D
none of these
Solution:
$t_{1 / 2}\alpha a^{1 - n}$
or $t_{1 / 2}=ka^{1 - n}$
$logt_{1 / 2}=logk+\left(\right.1-n\left.\right)loga$
so slope $=1-n$
or $1-n=0$
or $n=1$