- Tardigrade
- Question
- Physics
- Two different rods A and B are kept as shown in the figure. <img class=img-fluid question-image alt=image src=https://cdn.tardigrade.in/img/question/physics/24383d9ad9d16c04f7a6856ff47105ad-.png /> The variation of temperature of different cross-sections is plotted in the graph shown in the figure. Find the ratio of thermal conductivities of B to A.
Q.
Two different rods and are kept as shown in the figure.
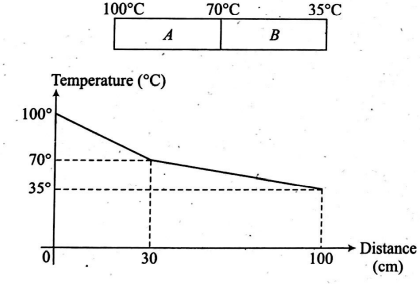
The variation of temperature of different cross-sections is plotted in the graph shown in the figure. Find the ratio of thermal conductivities of to .
Answer: 2
Solution: