- Tardigrade
- Question
- Physics
- The voltage time (V-t) graph for triangular wave having peak value V0 is as shown in figure. <img class=img-fluid question-image alt=image src=https://cdn.tardigrade.in/img/question/physics/e96f14e846d9b69b8343b5271c168c01-.png /> The rms value of V in time interval from t=0 to T / 4 is
Q.
The voltage time graph for triangular wave having peak value is as shown in figure.
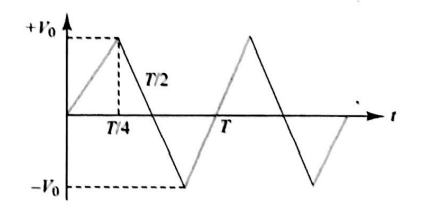
The rms value of in time interval from to is
Solution: