Q. The shape of oxygen dissociation curve plotted between saturation of with and is
Solution:
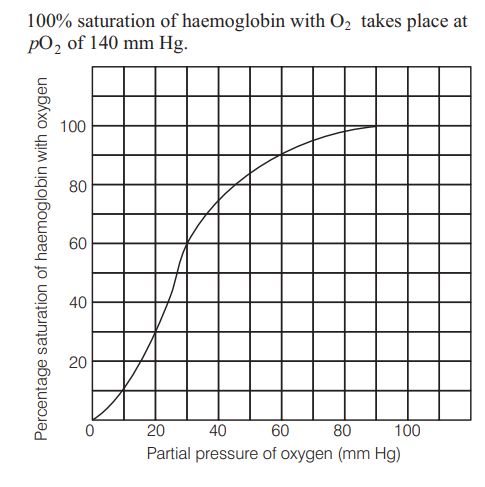
Oxygen haemoglobin dissociation curve is sigmoid-shaped.
The relationship between the and the per cent saturation of haemoglobin when represented on a graph is termed as oxygen haemoglobin dissociation curve. The in the arterial blood is about and the per cent saturation of haemoglobin at this partial pressure is .