Tardigrade
Tardigrade - CET NEET JEE Exam App
Exams
Login
Signup
Tardigrade
Question
Mathematics
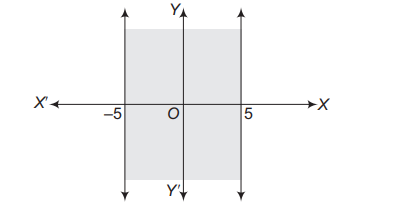
The inequality representing the following graph is
Q. The inequality representing the following graph is
102
212
Linear Inequalities
Report Error
A
∣
x
∣
<
5
21%
B
∣
x
∣
≤
5
65%
C
∣
x
∣
>
5
9%
D
∣
x
∣
≥
5
5%
Solution:
The inequality representing in the graph is
x
≥
−
5
and
x
≤
5
i.e.,
∣
x
∣
≤
5
(
∵
∣
x
∣
≤
a
⇔
−
a
≤
x
≤
a
)