Tardigrade
Tardigrade - CET NEET JEE Exam App
Exams
Login
Signup
Tardigrade
Question
Physics
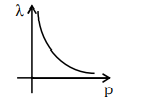
The graph which shows the variation of the de Broglie wavelength (λ) of a particle and its associated momentum ( p ) is :
Q. The graph which shows the variation of the de Broglie wavelength
(
λ
)
of a particle and its associated momentum (
p
)
is :
11470
237
NEET
NEET 2022
Dual Nature of Radiation and Matter
Report Error
A
B
C
D
Solution:
λ
=
p
h
Graph will be hyperbolic