- Tardigrade
- Question
- Physics
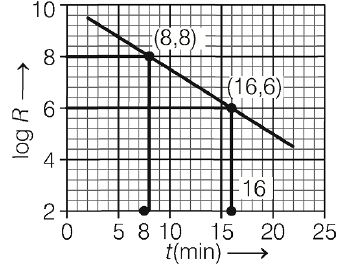
- The graph shows the log of activity log R of a radioactive material as a function of time t in minutes <img class=img-fluid question-image alt=image src=https://cdn.tardigrade.in/img/question/physics/9bf3e105a08ebd936a6f3dad1dbf460d-.jpeg /> The half-life (in minute) for the decay is closest to
Q.
The graph shows the log of activity of a radioactive material as a function of time in minutes

The half-life (in minute) for the decay is closest to
Solution: