Question Error Report

Thank you for reporting, we will resolve it shortly

Back to Question

Q. 
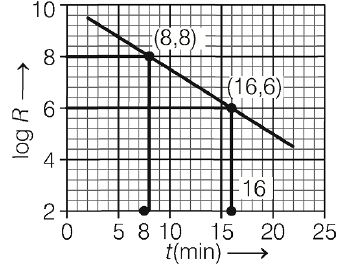
The graph shows the log of activity $\log \,R$ of a radioactive material as a function of time $t$ in minutes
image
The half-life (in minute) for the decay is closest to

KVPYKVPY 2018Nuclei

Solution:

Activity of a radioactive sample is given by
$R=-\frac{dN}{dt}=-\frac{d}{dt}N_{o}e^{-\lambda t}=\lambda N_{o}.e^{-\lambda t}$
so, $\log R = \log \left(\lambda N_{o}\right)+\log \left(e^{-\lambda t}\right)$
$\Rightarrow \log R =-\lambda t+ \log \left(\lambda N_{o}\right)$
This equation is form of $y = mx + C\,\,\,\, $
So, absolute value of slope of $\log \,R$ versus $t$ graph gives decay constant $\lambda.$
Now, from graph,
image
we get, slope $=|\frac{8-6}{8-16}|=\frac{1}{4}=\lambda$
So, half-life time period of sample is
$T _{1 }=\frac{\log_{2}}{\lambda}=\frac{0.693}{1 4} \approx 3.0 \,min$