Tardigrade
Tardigrade - CET NEET JEE Exam App
Exams
Login
Signup
Tardigrade
Question
Chemistry
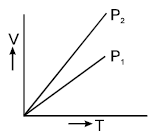
The given figure represents Isobars drawn at constant pressure P1 and P2 , for an ideal gas. Which is correct? <img class=img-fluid question-image alt=Question src=https://cdn.tardigrade.in/q/nta/c-opimjtulvfdgzvwk.jpg /> .
Q. The given figure represents Isobars drawn at constant pressure
P
1
and
P
2
, for an ideal gas. Which is correct?
.
100
216
NTA Abhyas
NTA Abhyas 2020
Report Error
A
P
1
>
P
2
B
P
1
<
P
2
C
P
1
=
P
2
D
All
Solution:
V
=
P
n
RT
Slope of
V
v
s
T
graph increases as pressure decreases.
Hence,
P
1
>
P
2
.
 .
.
.
.