Tardigrade
Tardigrade - CET NEET JEE Exam App
Exams
Login
Signup
Tardigrade
Question
Chemistry
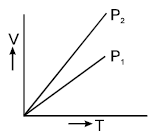
The given figure represents Isobars drawn at constant pressure P1 and P2 , for an ideal gas. Which is correct? <img class=img-fluid question-image alt=Question src=https://cdn.tardigrade.in/q/nta/c-opimjtulvfdgzvwk.jpg /> .
Question Error Report
Question is incomplete/wrong
Question not belongs to this Chapter
Answer is wrong
Solution is wrong
Answer & Solution is not matching
Spelling mistake
Image missing
Website not working properly
Other (not listed above)
Error description
Thank you for reporting, we will resolve it shortly
Back to Question
Thank you for reporting, we will resolve it shortly
Q. The given figure represents Isobars drawn at constant pressure $P_{1}$ and $P_{2}$ , for an ideal gas. Which is correct?
.
NTA Abhyas
NTA Abhyas 2020
A
$P_{1}>P_{2}$
B
$P_{1} < P_{2}$
C
$P_{1}=P_{2}$
D
All
Solution:
$V=\frac{nRT}{P}$
Slope of $V$ $vs$ $T$ graph increases as pressure decreases.
Hence, $P_{1}>P_{2}$ .
 .
.
.
.