- Tardigrade
- Question
- Physics
- The following figure shows the Maxwell’s speed distribution plots at four different temperatures T1 , T2 , T3 and T4 <img class=img-fluid question-image alt=image src=https://cdn.tardigrade.in/img/question/physics/86341f0eebc773aa164028ca94a2a780-.jpeg /> Which of the following gives the correct relation between temperatures ?
Q.
The following figure shows the Maxwell’s speed distribution plots at four different temperatures , , and
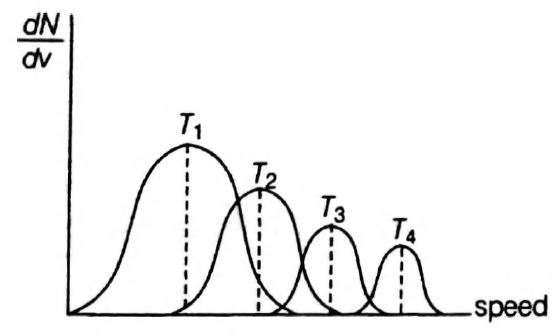
Which of the following gives the correct relation between temperatures ?
Solution: