Question Error Report

Thank you for reporting, we will resolve it shortly

Back to Question

Q. The following figure shows the Maxwell’s speed distribution plots at four different temperatures $ T_1 $ , $ T_2 $ , $ T_3 $ and $ T_4 $
image
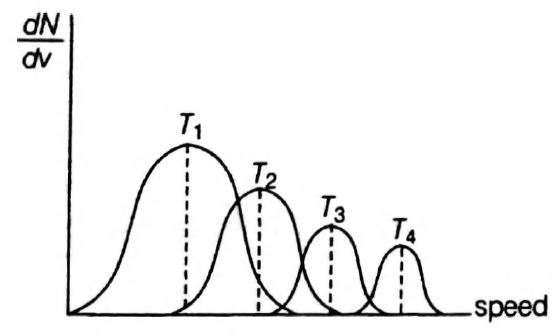
Which of the following gives the correct relation between temperatures ?

AMUAMU 2013Kinetic Theory

Solution:

In Maxwell’s speed distribution plot the total fraction of molecules when are lying between a particular velocity range is a constant at constant temperature.
So, here $T_4 >T_3 >T_2 > T_1$.