Tardigrade
Tardigrade - CET NEET JEE Exam App
Exams
Login
Signup
Tardigrade
Question
Physics
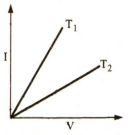
The current voltage graph for a given metallic conductor at two different temperatures T1 and T2 are as shown in the figure. Then
Q. The current voltage graph for a given metallic conductor at two different temperatures
T
1
and
T
2
are as shown in the figure. Then
2043
266
KCET
KCET 2002
Current Electricity
Report Error
A
nothing can be said about
T
1
and
T
2
7%
B
T
1
<
T
2
42%
C
T
1
>
T
2
35%
D
T
1
=
T
2
17%
Solution:
T
2
is more than
T
1