Tardigrade
Tardigrade - CET NEET JEE Exam App
Exams
Login
Signup
Tardigrade
Question
Physics
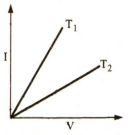
The current voltage graph for a given metallic conductor at two different temperatures T1 and T2 are as shown in the figure. Then
Question Error Report
Question is incomplete/wrong
Question not belongs to this Chapter
Answer is wrong
Solution is wrong
Answer & Solution is not matching
Spelling mistake
Image missing
Website not working properly
Other (not listed above)
Error description
Thank you for reporting, we will resolve it shortly
Back to Question
Thank you for reporting, we will resolve it shortly
Q. The current voltage graph for a given metallic conductor at two different temperatures $T_1$ and $T_2$ are as shown in the figure. Then
KCET
KCET 2002
Current Electricity
A
nothing can be said about $T_1$ and $T_2$
7%
B
$T_1 < T_2$
42%
C
$T_1 > T_2$
35%
D
$T_1 = T_2$
17%
Solution:
$T_2$ is more than $T_1$