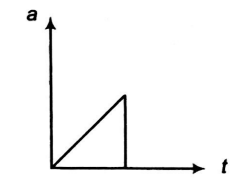
From given a−t graph acceleration is increasing at constant rate ∴dtda=k (constant) ⇒a=kt (by integration) ⇒dtdv=kt⇒dv=ktdt ⇒∫dv=k∫tdt⇒v=2kt2R
i.e., v is dependent on time parabolically and parabola is symmetric about v-axis and suddenly acceleration becomes zero. i.e., velocity becomes constant. Hence the most stable graph is (c).