Question Error Report

Thank you for reporting, we will resolve it shortly

Back to Question

Q. The acceleration-time graph of a body is shown below
image
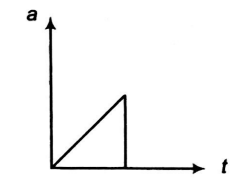
The most probable velocity-time graph of the body is

ManipalManipal 2014

Solution:

From given $a-t$ graph acceleration is increasing at constant rate
$\therefore \frac{d a}{d t}=k $ (constant)
$\Rightarrow a=k t$ (by integration)
$\Rightarrow \frac{d v}{d t}=k t \Rightarrow d v=k t d t $
$\Rightarrow \int d v=k \int t d t \Rightarrow v=\frac{k t^{2}}{2}R$
i.e., $v$ is dependent on time parabolically and parabola is symmetric about $v$-axis and suddenly acceleration becomes zero. i.e., velocity becomes constant. Hence the most stable graph is (c).