- Tardigrade
- Question
- Biology
- Following graphs show the effect of change in concentration of substrate on enzyme activity. <img class=img-fluid question-image alt=image src=https://cdn.tardigrade.in/img/question/biology/e5a003ceee267d46a8846292825f7927-.png /> <img class=img-fluid question-image alt=image src=https://cdn.tardigrade.in/img/question/biology/92f53e4e6d3b12bdbc10c8df14b644e3-.png /> In which of the above graphs, the enzyme shows maximum substrate affinity?
Q.
Following graphs show the effect of change in concentration of substrate on enzyme activity.

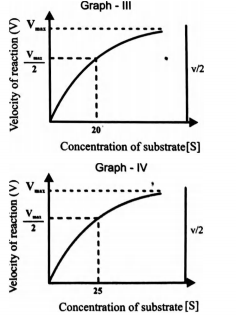
In which of the above graphs, the enzyme shows maximum substrate affinity?
Solution: