Q.
Following graphs show the effect of change in concentration of substrate on enzyme activity.

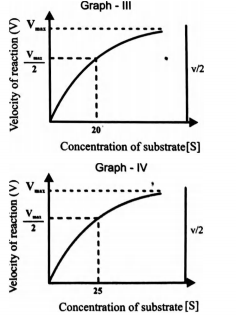
In which of the above graphs, the enzyme shows maximum substrate affinity?
Biomolecules
Solution: