Q. Which of the following graphs shows variation of potential energy ($U$) with position x?
J & K CETJ & K CET 2006Work, Energy and Power
Solution:
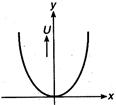
The variation of potential energy $(U)$ with distance $(x)$ is $ U=\frac{1}{2}kx^{2} $
Hence, parabolic graph is obtained.