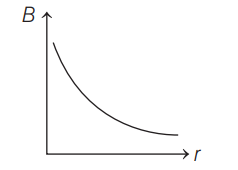
As magnetic field due to a current carrying straight wire of infinite length
$B = \frac{\mu_{0}i}{2\pi} . \frac{1}{r} $
$ \Rightarrow B \propto \frac{1}{r} $
So, the graph between magnetic induction $B$ and distance r from the conductor is rectangular hyperbola.