Q.
The same progressive wave is represented by two graphs I and II. Graph I shows how the displacement ' $y$ ' varies with the distance $x$ along the wave at a given time. Graph II shows how $y$ varies with time $t$ at a given point on the wave. The ratio of measurements $A B$ to $C D$, marked on the curves, represents: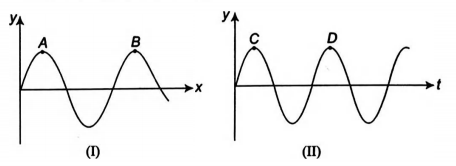
Waves
Solution: