Q.
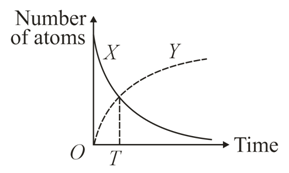
The graph represents the decay of a newlyprepared sample of radioactive nuclide X to a stable nuclide Y. The half-life of X is t. The growth curve for Y intersects the decay curve for X after time T. What is the time T?
NTA AbhyasNTA Abhyas 2022
Solution: