Question Error Report

Thank you for reporting, we will resolve it shortly

Back to Question

Q. 
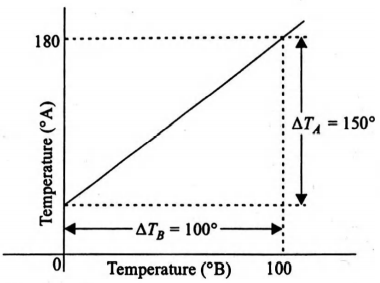
The graph between two temperature scales $A$ and $B$ is shown in figure. Between upper fixed point and lower fixed point there are 150 equal division on scale $A$ and 100 on scale $B$. The relationship for conversion between the two scales is given byPhysics Question Image

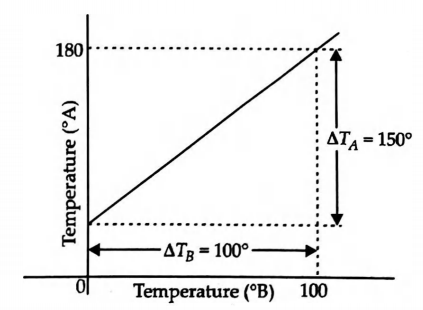
Thermal Properties of Matter

Solution:

image
From the graph
For the scale $A$, Lower fixed point $=30^{\circ} A$
Upper fixed point $=180^{\circ} A$
For the scale $B$,
Lower fixed point $=0^{\circ} B$
Upper fixed point $=100^{\circ} B$
$\therefore $ The relationship between the two scales $A$ and $B$ is given by
$\frac{T_{A}-30}{150}=\frac{T_{B}-0}{100}=\frac{T_{B}}{100}$