Thank you for reporting, we will resolve it shortly
Q.
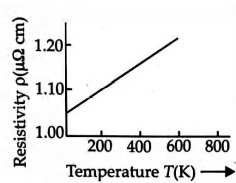
The graph between resistivity and temperature, for a limited range of temperatures, is a straight line for a material like
Current Electricity
Solution:
For a limited range of temperatures, the graph between resistivity and temperature is a straight line for a material like nichrome as shown in the figure.